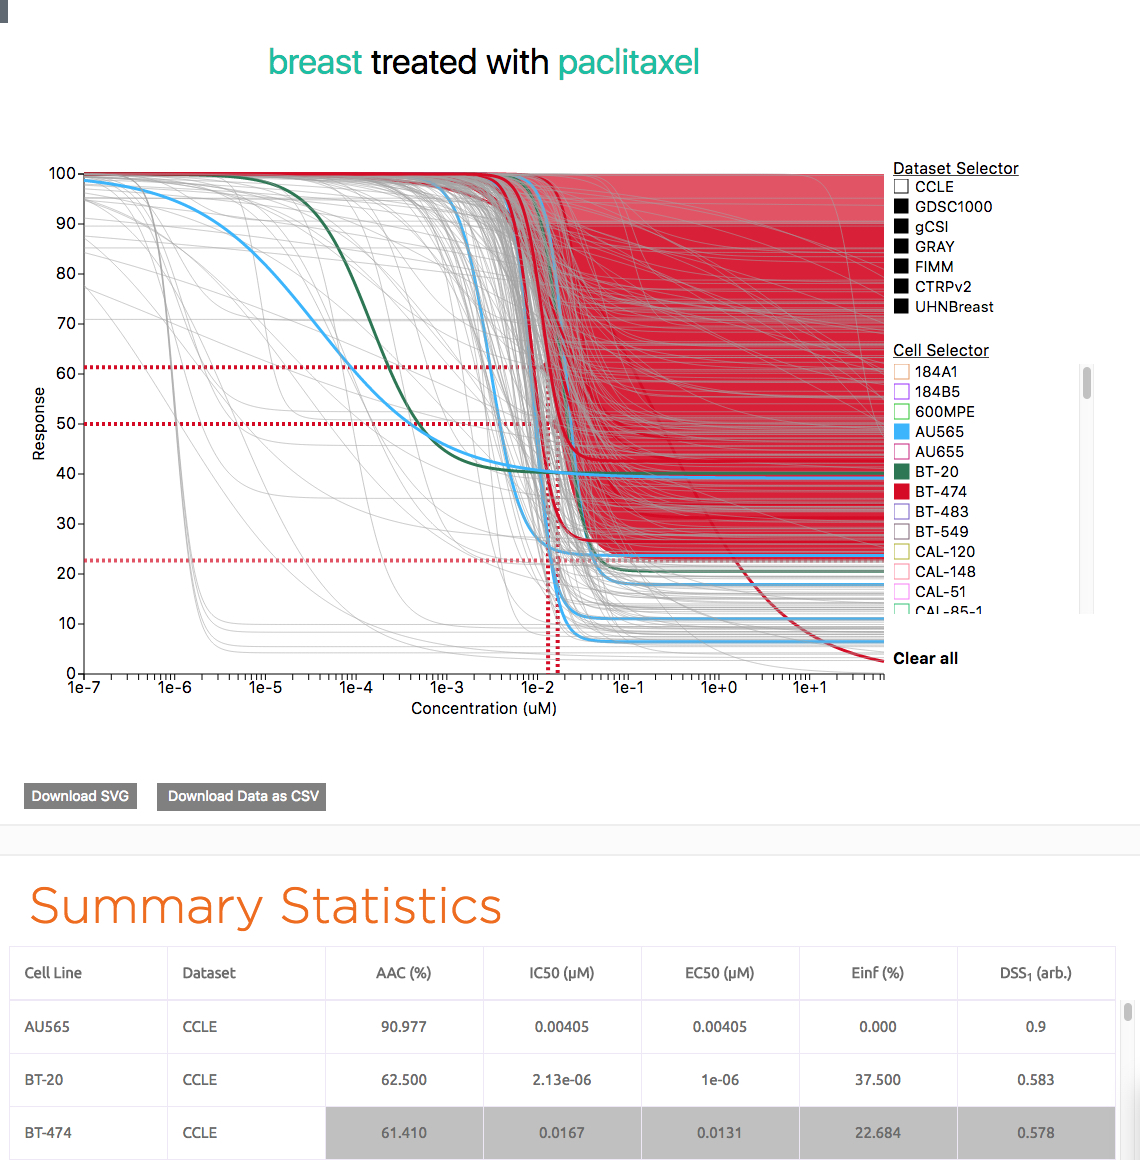
Each tissue-drug combination included in PharmacoDB has a webpage associated with it. This page can be accessed by typing the names of the tissue and drug into the search bar, separated by a space. The order of tissue and drug names do not matter.

The page contains a plot recording the doses of that drug tested on that tissue in each dataset, along with the cell viability values that were observed at those doses. The curves can be filtered by dataset, and highlighted by cell line. There is also a summary statistics plot which has hoverable/clickable statistics for each cell line.
