Each cell line included in PharmacoDB has a cell line page associated with it. These pages can be accessed either by clicking on the "Cell lines" link at the bottom of the homepage, or by searching for a cell line through the search bar.

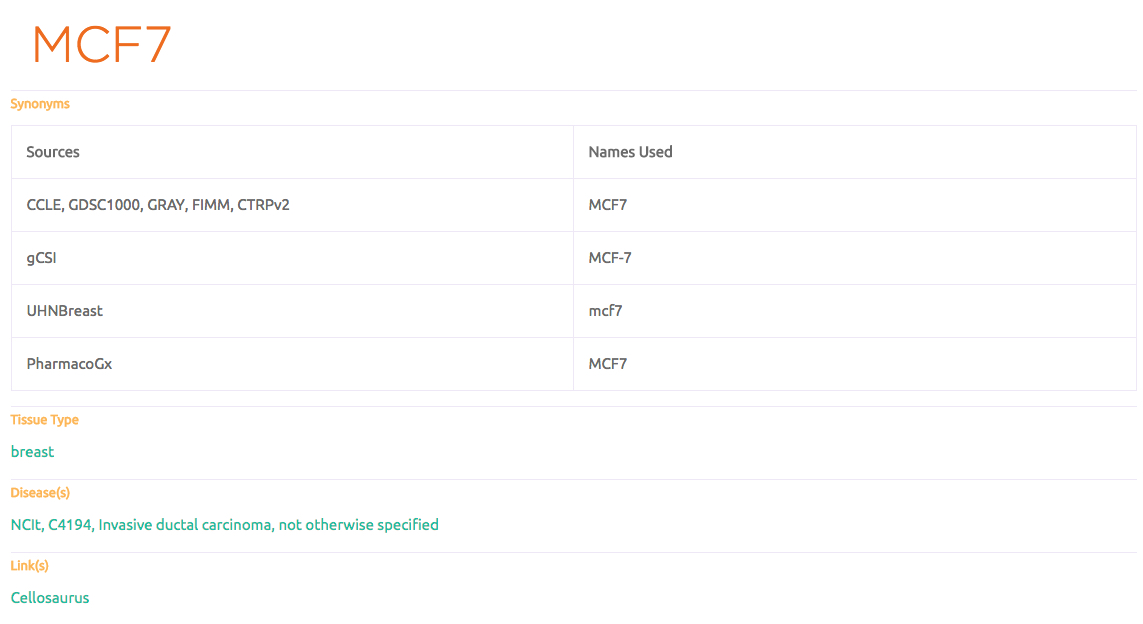
Each cell line page starts with a card which displays information about the tissue type of the cell line, its synonyms in each dataset that used it, its Cellosaurus name, and the diseases it was used to model.
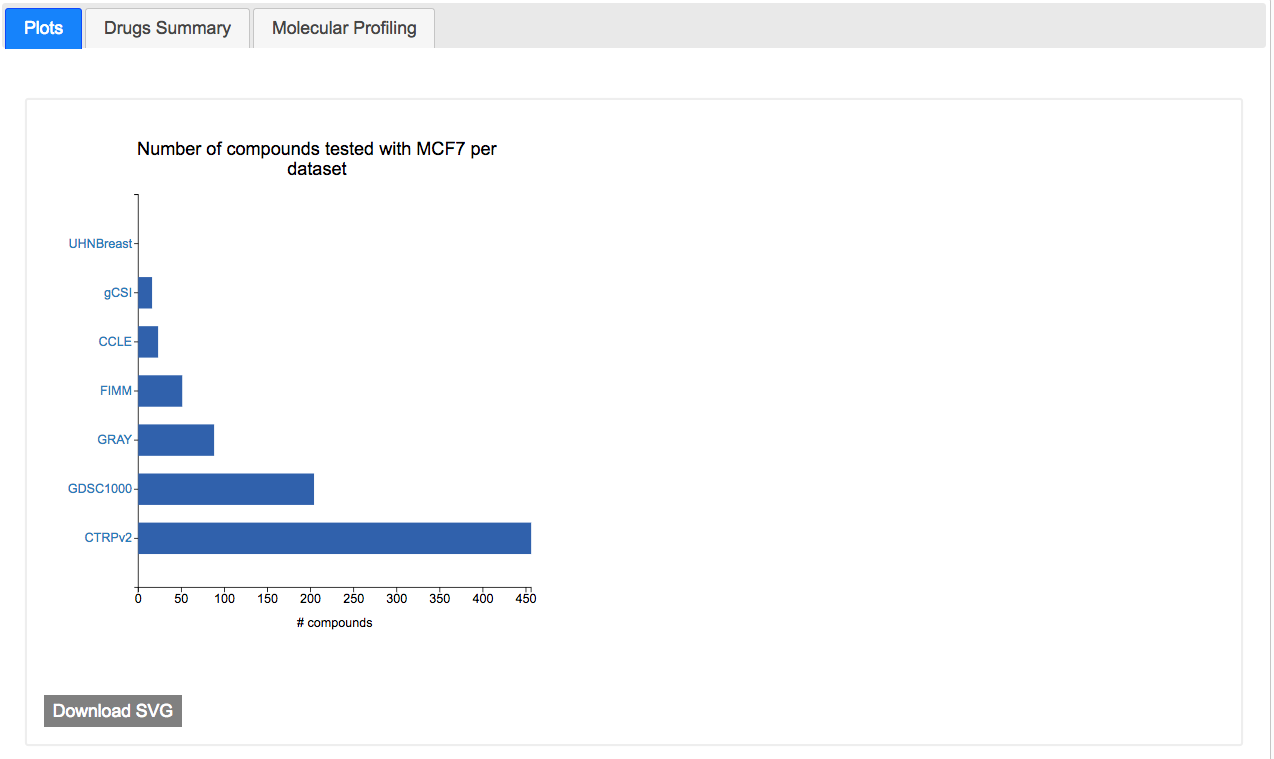
The page has a plot comparing the total number of drugs tested on the cell line in each PharmacoDB dataset.
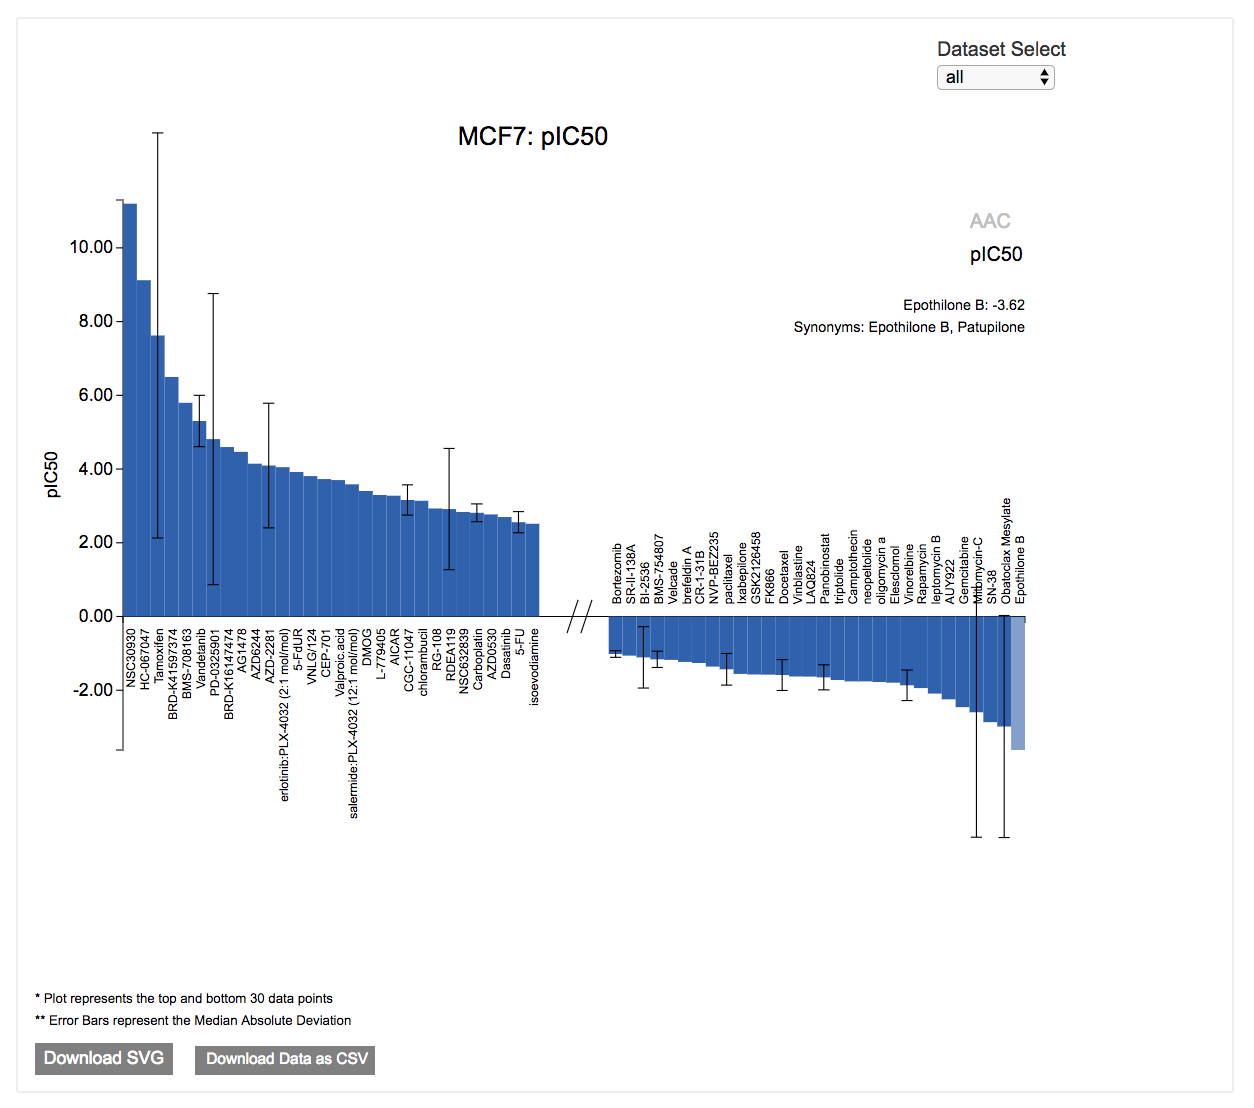
Then, there is a waterfall plot displaying the most and least sensitive drugs tested with the cell line. There is a switch to show the AAC/pIC50 (logIC50) values, and a dataset selector to show only the experiments in the desired dataset. Hovering over each bar shows the synonyms of the drug, and the AAC/pIC50 of the experiment.
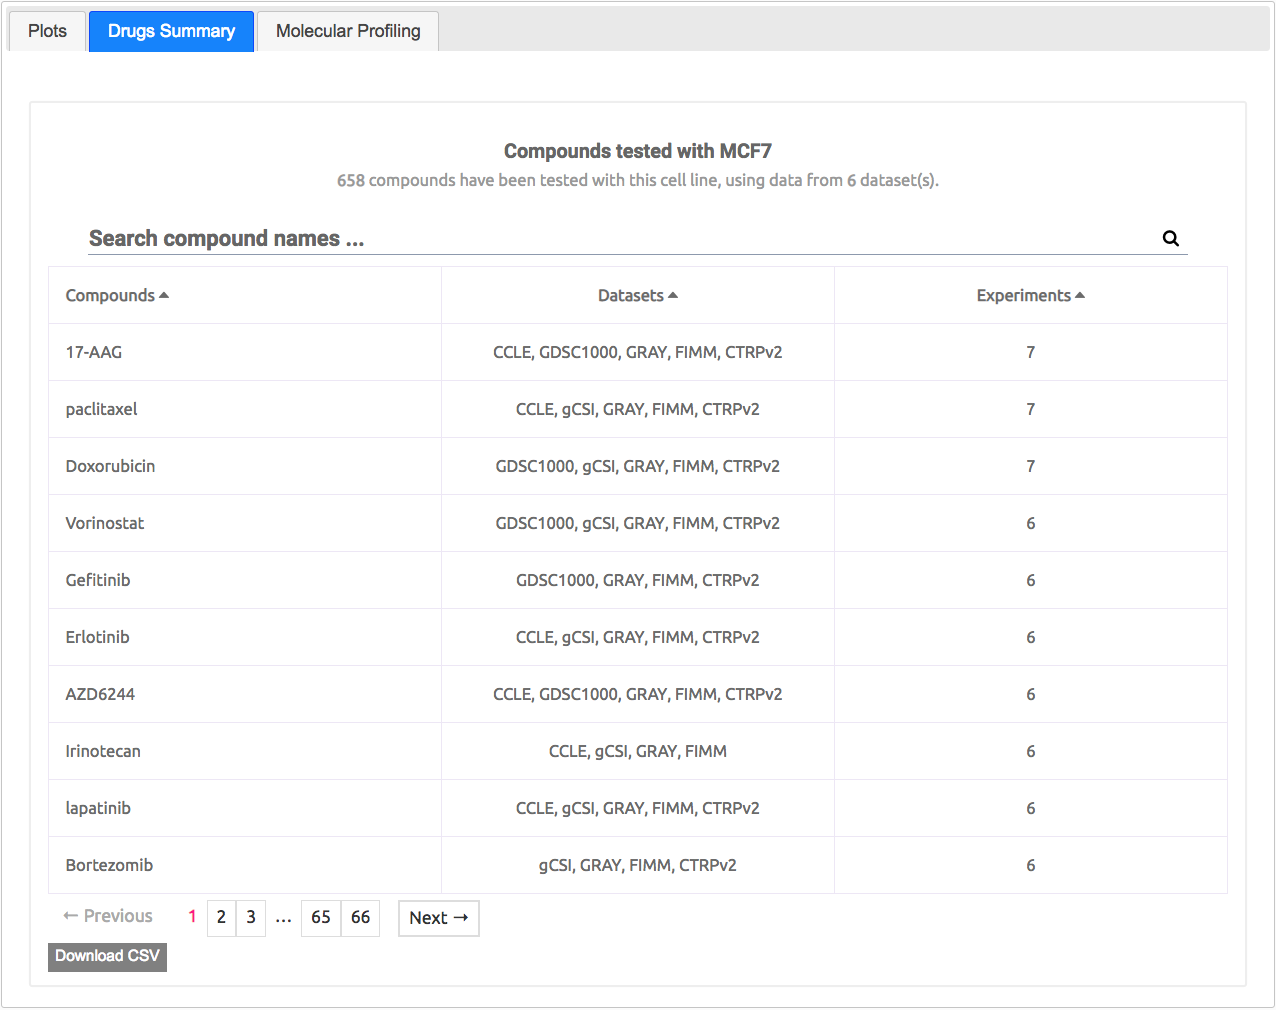
The page also has a table of all the drugs tested on the cell line in each dataset, with the list of datasets where this combination was tested and the total number of experiments across all studies. Clicking on a drug name or dataset name will take you to the corresponding page.
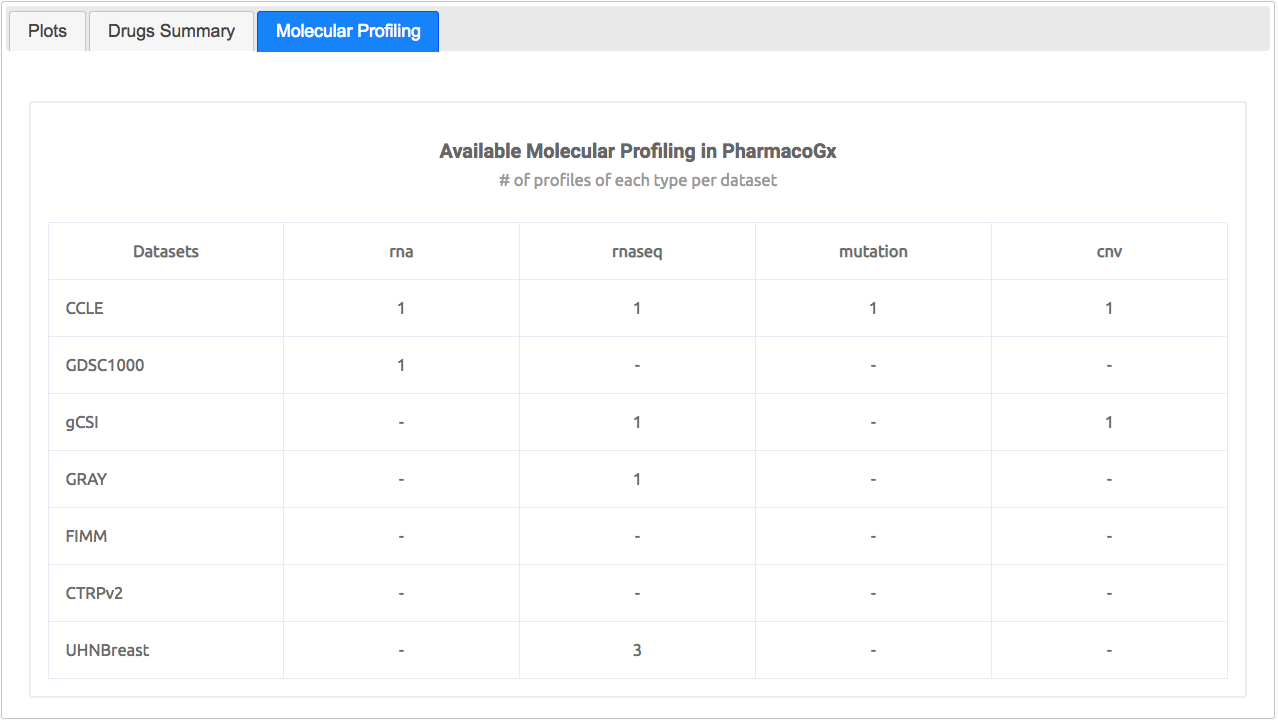
Finally, there is a table summarizing the available molecular profiling in PharmacoGx for the cell line.